


|
|
|
|
|
|
Factors listed by strength: LaneWidth=, |
|
|
|
|
|
|
Factors listed by strength: LaneWidth=, |

| Show partial land uses: L ft, R ft | |
| Show same as currently displayed | |
| Show full land uses | |
| Just ROW and any Setbacks |
|
||||||||||||||||||||
| Letter: Px/ft = Px, or inches | |
| Tabloid: Px/ft = Px, or inches | |
| Plotter: Px/ft = Px, or inches | |
| Custom: Px/ft = Px, or inches | |
Quick & Dirty Print Options | |
| Choose a best-fit cell then "Done" | For contexts that will maintain low residential densities and modest Suburban commercial, a focus on higher speed may be appropriate. | For areas with potential for General Urban and higher (T4-T6), ITE recommends slower streets with narrower lanes as per best practices for Boulevards, Avenues and Streets. |
| Here is how you defined your street: | |
| Context: | |
| Dominant Land Use: | |
| Type: | |
| Function: | |
| Truck/Bus: | |
| The Institute of Transportation Engineers recommends that function as in emerging Urban contexts | |
| An exception is made when a street has more than 5% extra large vehicles, where it may be appropriate for one or more lanes to be 12 feet. |
|
|
|
|
||||||||||||||||||


|
|
|
||||||||||||||||||||||||||||||||||||||||||||||||||||||||


- Instructions:
- Copy to Same Project (default): Just click “Done” and all alternatives of selected street will be copied as a template for a new street.
- Copy/Move to Different Project: Select destination project (top right), then “Done.” Then login to that project to modify.
- Instructions:
- Copy to Same Street (default): Just click “Done” then modify the new copy.
- Copy/Move to Different Street, Same Project: Select the street you want in the bottom right box, “Done,” then modify.
- Copy/Move to Different Project: Select destination project (top box), then a destination street (bottom box).
| Street Name | |
| Description |
(Drag 3+ to position 1 or 2 for display)
|
Street Attributes
|
|||
| Street Name | |||
| Description | |||
| Cross Section Type | |||
| Left-Side Label |
|||
| Right-Side Label | |||
| Alternative Attributes |
|||
| Alternative Description | |||
| Situation Type | |||
| Display Height, Manual | feet of available | ||
| Display Height, Auto | feet of available | ||
| Values and Priorities | |
| 1 - High Priority, 5 - Low Priority | |
| Vehicle Capacity | |
| Traffic Calming | |
| Safety Improvements | |
| Placemaking | |
| Transit Upgrades | |
| Pedestrian Improvements | |
| Bike Accommodations | |
| Crosswalk improvements | |
| On-street parking |
| Neighborhood Attributes | |||
| Development Context | |||
| Dev. Sub-Context | |||
| Dominant Land Use | |||
| Network Type (1-mile) | |||
| Operational Attributes | |||
| Functional Type | |||
| Thoroughfare Type | |||
| Average Daily Traffic | |||
| Large Trucks |
|||
| Transit Service |
|||
| Bike Facilities |
|||
| Traffic Mgt. Plans |
|||
|
Left Building
|
Left Setbacks
|
Walkway
|
Landscape
|
Furniture & Landscape
|
Curbside
|
Parking
|
Bike Lane
|
Transit Only Lane
|
Travel Lanes
|
|
|
|
|
|
|
|
|
|
|
|
|
|
|
|
|
|
|
|
|
|
|
|
Ft. |
Ft. |
Ft. |
Ft. |
Ft. |
Ft. |
Ft. |
Ft. |
Ft. |
Ft. |
|
Median
|
|||||||
|
|
|||||||
|
|
|||||||
|
Ft. |
|||||||
|
Travel Lanes
|
Transit Only Lane
|
Bike Lane
|
Parking
|
Curbside
|
Furniture & Landscape
|
Landscape
|
Walkway
|
Right Setbacks
|
Right Building
|
|
|
|
|
|
|
|
|
|
|
|
|
|
|
|
|
|
|
|
|
|
|
|
Ft. |
Ft. |
Ft. |
Ft. |
Ft. |
Ft. |
Ft. |
Ft. |
Ft. |
Ft. |
|
Current ROW Width:
(
Left =
Center =
Right =
) Left setback: Right setback: |
Cancel
|
| To change ID#, click and drag to new position |
|
Done
|
|
Type up to 2048 characters here to explain this cross-section ( of )
|
Save and Close |
|
1
|
|
|
|
|
|
|
2
|
|
|
|
|
|
Do you want to save this street? | |
Save this street when I login or register. |
|
This is just a test street that I see no need to keep beyond this session. |
|
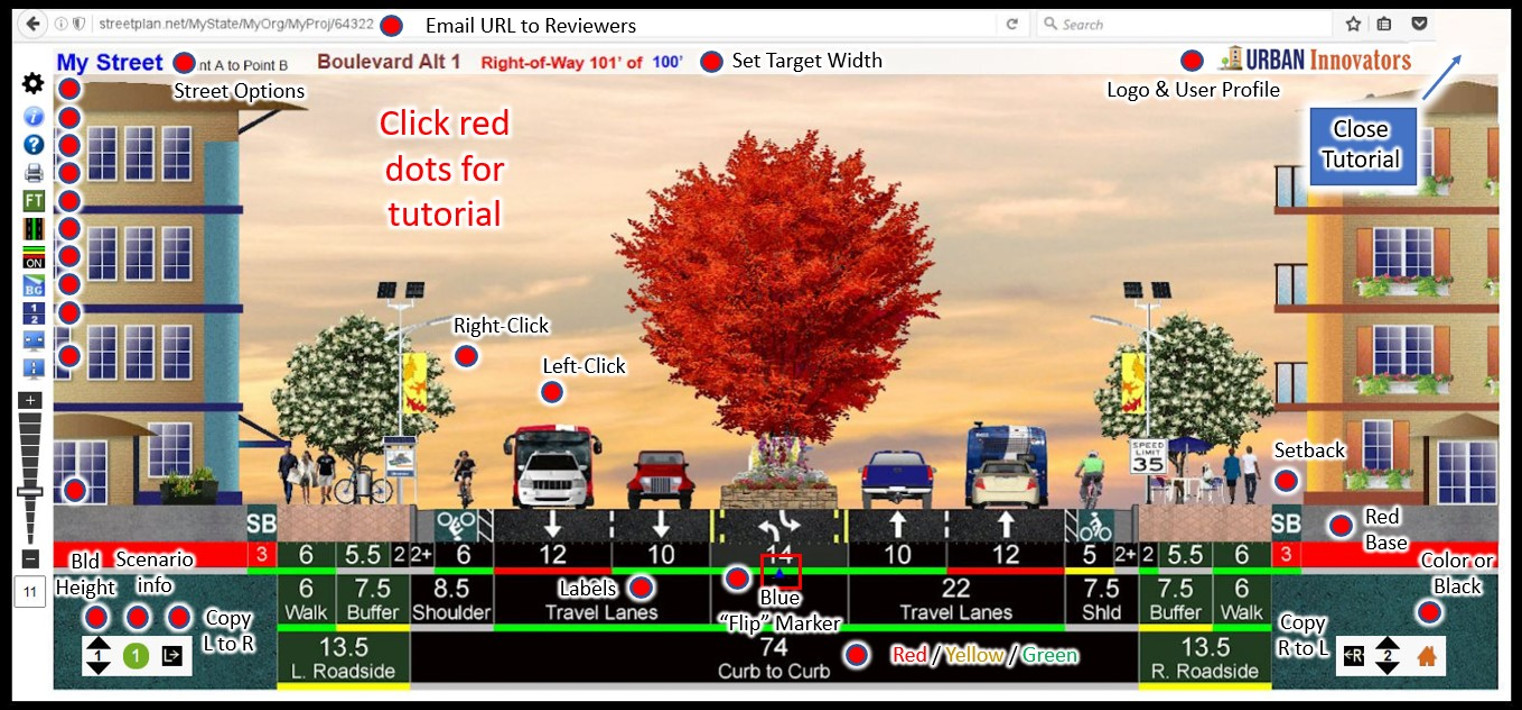
Click to return to the Control Center.
Click to learn about the main cross section design window.
Click My Street to manage scenarios
|
|
Use Twitter to tell about StreetPlan! |
|
|
Use Facebook to tell about StreetPlan! |
Email our address!
After you login with the gear tool, new options will appear here, allowing you to share the link to your specific design ideas.
Miles


|
This price assumes segment is: 0.25 mi. long, 11.0-ft wide, and meets these criteria: (Arterial , New Asphalt , New Street) |
Note: Cost is the total Square Feet of the lane (computed from project length and lane width), multiplied by $/SF for installing the various materials, and removing previous materials. $/SF is computed on Tab 3 and is a function of Tab 2 and Tab 4. |
| Street Type | |
|
|
|
|
|
|
|
|
| *Surface Type | |
|
|
|
|
|
|
|
|
|
|
|
| **Project Type | Pavement? | Base Course? | Borrow? | |
|
|
|
|
|
|
|
|
|
|
|
|
|
|
|
NA
|
NA
|
|
|
|
NA | NA | NA |
|
|
*Tab 2, Thickness: This tab shows typical thickness for each layer, which varies by street type and material type.
**Tab 3, $Installed: This shows the installation price per square foot of materials, which depends on Tab 2 (thickness) and Tab 4 (material price)
Project type check boxes: New Street assumes you need to first remove native soil then install borrow, base, and pavement. If your soil is soft or clay, you will need borrow. If it is already very hard (sand, gravel, and rocks), borrow may not be needed. A total rebuild may or may not need all the above. Check what you think should define each project type.
|
Material Thickness Assumption (inches) for Vehicle Lane and Shoulders |
Note: Based on your selections from Tab 1, this tab shows the thickness of each layer. The total thickness (i.e., the amount of material you must remove prior to install), is the sum of the materials you need (i.e., sum of “Yes” shown in the first column). |
| Tab 1 Selected? | Material Type | Material Position | Arterial | Collector | Local |
|---|---|---|---|---|---|
| Asphalt | Top Layer, or | 6 | 4 | 3 | |
| Concrete | Top Layer, or | 8 | 6 | 5 | |
| Pavers / Stamped Concrete. | Top Layer, and | 8 | 6 | 5 | |
| Base | Middle Layer | 10 | 8 | 6 | |
| Borrow | Bottom Layer | 12 | 10 | 8 | |
| Material Removal | Top + Middle + Bottom | 30 | 24 | 19 |
Notes: Base = Untreated Base Coarse (UTBC); Borrow = Granular Borrow; Material Removal is the sum of pavement chosen, base and borrow. Paver thickness assumes a sandy underlay.
|
Material Installation Cost Assumption ($/SqFt) *Base = Untreated base Coarse (UTBC); Borrow = Granular Borrow |
| Material | Arterial | Collector | Local | Factor | Arterial | Collector | Local |
|---|---|---|---|---|---|---|---|
| Asphalt | $3.80 | $2.53 | $1.90 | Factored | Factored | Factored | |
| Concrete | $5.68 | $4.26 | $3.55 | Factored | Factored | Factored | |
| Pavers | $6.91 | $5.19 | $4.32 | Factored | Factored | Factored | |
| Base* | $2.22 | $1.78 | $1.33 | Factored | Factored | Factored | |
| Borrow* | $2.41 | $2.01 | $1.60 | Factored | Factored | Factored | |
| Material Removal | $3.24 | $2.59 | $2.05 | Factored | Factored | Factored |
|
Note: Values above represent commonly installed cost based on prices in the Intermountain West. Use factors if you believe your area/situation is higher or lower than this. |
|
|
Note: $/SF is calculated from bulk prices ($/ton or $/cuyd), and also from the depth of the material, which varies by roadway type. Click 4: Bulk to see bulk values and edit so that the $/SF values above will change. See assumed thicknesses on 2: Thickness. |
|
Material Installation Cost Assumption ($/Ton or $/Cuyd) *Base = Untreated Base Coarse (UTBC); Borrow = Granular Borrow |
Apply these values to all Alternatives
|
| Material | $/ton | $/cuyd | Factor | $/ton | $/cuyd |
|---|---|---|---|---|---|
| Asphalt | $120 | $240 | |||
| Concrete | Factored | Factored | |||
| Pavers | Factored | Factored | |||
| Base* | Factored | Factored | |||
| Borrow* | Factored | Factored | |||
| Material Removal | Factored | Factored |
|
Note: Bulk prices are often reported as either $/ton or $/cuyd, and installation is presumed in the price. You can change these values or use the factor to get closer to your local situation. These values are divided by the thicknesses on 2: Thickness to achieve the Square Foot prices of 3: Installed. |
|
Cost of Median: 0.25 mi. long, 11.0-ft wide, where street is... (Arterial, New Asphalt , New Street) |
For cost estimation, check the median styles that most closely match what will be included in your project. Also estimate the percentage of the overall median footprint that each type will occupy. |
Note : Cost also assumes road base and excavation. Costs do not account for annual maintenance
|
Cost of Gutter / Barrier: 0.25 mi. long, 2.5-ft wide |
|
Cost Calculation
- 0.25 miles * 5280 ft / mile = 1320 Linear Feet.
- 1320 feet * 2.5 feet wide = 3,300 SqFt
- 3,300 SqFt * $14.80 / SF = $49,000
|
Cost of Sign/Light Zone 0.25 mi. long, 2.5-ft wide |
|

FYI: The Sign/Light zone contains a surface material (concrete, pavers, grass, etc.). It also typically contains streetlights and info signs.
Light + Sign Cost Calculation:
- 0.25 miles * 5280 ft/mile = 1320 Linear Feet.
- 1320 feet / 120 ft spacing = 11 Pole Units.
- 11 Pole Units * $3000 / unit = $33000 for lights
- $33000 * .1 (random signs, etc.) = $3000 for signs
- Total = $33000 lights + $3000 misc = $36000
Material Cost Calculation:
- 0.25 miles * 5280 ft/mile = 1320 Linear Feet.
- 1320 feet * 2.5 ft wide = 3300 SqFt.
- 3300 SqFt * $7.00 / SqFt = $23000 for Surface Materials
Total Cost:
- $36000 Lights & Misc + $23000 Materials = $59,0000
| Spacing (ft) | $/unit | |
| Short (to 10') | 120 | $3000 |
| Medium (10-20') | 180 | $5000 |
| Tall (+20 ft) | 300 | $8000 |
| Default Lighting Costs | ||
| Material $/SF | wo/Base | w/Base |
| Concrete | $8.00 | $12.00 |
| Pavers | $10.00 | $14.00 |
| Asphalt | $4.00 | $8.00 |
| Other | $3.00 | $7.00 |
|
Include Granular Base?
|
||
|
Cost of Bike Lane and/or NEV path: 0.25 mi. long, 6-ft wide Select the closest match to your vision. |
|
|
|
$ SF values based on 2025 prices in Utah. Use factor to adjust up or down.
Factor:
|
||
Cost Calculation:
- 0.25 miles * 5280 ft/mile = 1320 Linear Feet.
- 1320 feet * 6.0 feet wide = 3300 SqFt.
- 3300 SqFt * $7.00 / SqFt = $23000
|
Cost of Utilities for street segment that is: 0.25 mi. long and... Situation type is: (Arterial, New Asphalt, Total Rebuild) change type |
Calc: $49k = $1611/LnFt * 5280 Ft/mi * 0.25mi |
| Already There or Not Needed | Add as part of New Street | Add or Upgrade with Retrofit | Cost per Linear Foot | Factor | Final Cost per Linear Foot | |
|---|---|---|---|---|---|---|
| Culinary Water |
|
|
|
$168 | $168 | |
| Fire Hydrants |
|
|
|
$50 | $50 | |
| Sanitary Sewer |
|
|
|
$199 | $199 | |
| Electricity (Buried) |
|
|
|
$408 | $408 | |
| Electricity (Poles) |
|
|
|
$228 | $228 | |
| Storm Drain |
|
|
|
$335 | $335 | |
| Secondary Water |
|
|
|
$168 | $168 | |
| Natural Gas |
|
|
|
$144 | $144 | |
| Communications |
|
|
|
$84 | $84 | |
| Traffic Signals |
|
|
|
$55 | $55 | |
| Total of All | $1,600 | $1,600 |
Instructions: Select situation for each. Default $/Linear foot based on 2025 prices in Utah. Use factor to adjust up or down depending on your probable costs relative to Utah. If your project will only replace say 50% of something, set factor = .5.
For cost estimating, enter the length over which this cross-section is valid. Default is 1.0 miles (i.e., cost per mile). If not 1.0 miles, then change for a sketch estimate of actual cost.
|
Cost of Walkway 0.25 mi. long, 6-ft wide |
|
Material:
Walkway Cost Calculation:
- 0.25 miles * 5280 ft/mile = 1320 Linear Feet.
- 1320 feet * 6.0 feet wide = 3300 SqFt.
- 3300 SqFt * $7.00 / SqFt = $23000 for Surface Materials
*Region Factor helps you raise or lower the default $/SF if the cost of installed material in your region is higher or lower than what in shown.
| Material $/SF | wo/Base | w/Base |
| Concrete | $8.00 | $12.00 |
| Pavers | $10.00 | $14.00 |
| Asphalt | $4.00 | $8.00 |
| Other | $3.00 | $7.00 |
|
Include Granular Base?
|
||
|
Cost of Buffer Zone: 0.25 mi. long, 6.0 -ft wide |
|
Current Streetscape Selection:
Choose an increasingly artistic investment scale that most closely matches your intent.
| Streetscape Quality | Cost per Linear Foot | $/SF Base |
$/SF Factor |
|
|---|---|---|---|---|
|
Suburban 1: Simple grass or gravel. Haphazard trees and random maintenance expectations. |
||||
|
Suburban 2: Asphalt, concrete, stamped concrete. Some flowers or bushes. Haphazard trees and random maintenance expectations. |
||||
|
Urban 1: Grass or Xeriscape with some flowers or bushes. More uniform tree situation, but not great due to poor soil and maintenance. |
||||
|
Urban 2: Pavers, uniform street trees in decent "structural soil". Benches, bike racks, flower beds increasingly common. |
||||
|
Urban 3: Similar, but trees planted in Silva cells or root trenches with loose organic soil to maximize canopy size and health. More artwork. |
*Region factor helps you raise or lower the default $/SF if the cost of installed material in your region is higher or lower than what is shown.
- 0.25 miles * 5280 ft / mile = 1320 Linear Feet.
- 1320 feet * 6.0 feet wide = 7920 SqFt
- 7920 SqFt * $9240.00 / SqFt = $18,400
|
Cost of Setback: 0.25 mi. long, 3.0-ft wide |
|
Note: A "Setback" is usually a privately owned space, often reserved for future expansion, and thereby must have only parking, signs, or landscaping (no significant buildings). It likely has zero cost to the government.
If this back will have a government funded cost, you may change the original zero value to some other $/SqFt that you think best represent the probable level of investment.
- 0.25 miles * 5280 ft / mile = 1320 Linear Feet.
- 1320 feet * 6.0 feet wide = 7920 SqFt
- 7920 SqFt * $9240.00 / SqFt = $18,400
Lane Widths: Lane width affects speed. Your average lane width is
highlighted (red), along with how speeds are factored relative to the Datum.
|


|
Number of Lanes: Number of lanes affects speed also. Your lanes in each direction is highlighted (red). The datum is two lanes. If you have just 1 lane each direction, speed will be lower, if you have more than 2, speed will be faster. |
||||
 |
 |
|||
 |
 |
|||
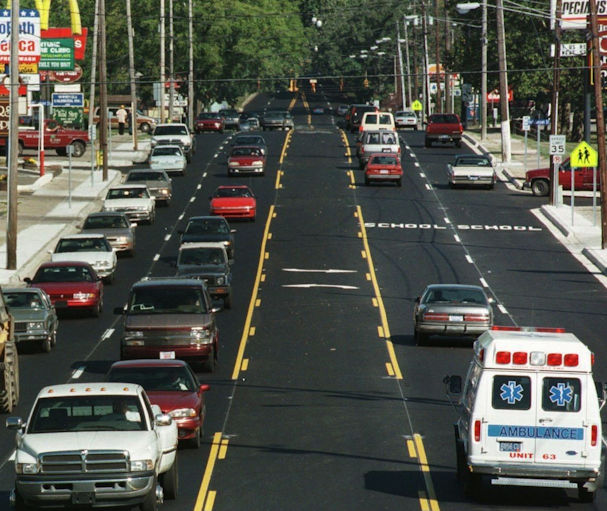
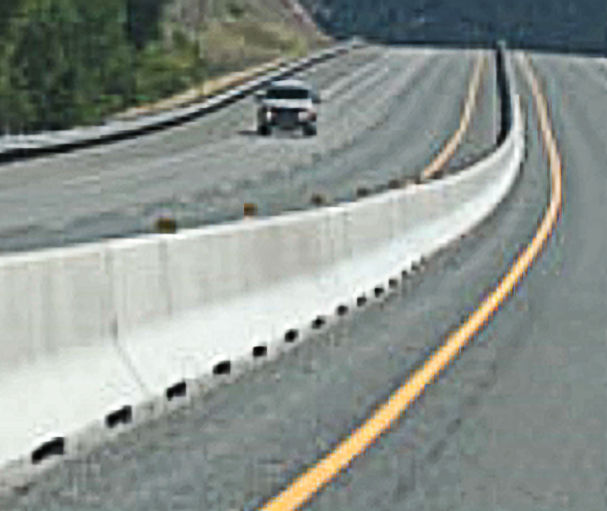
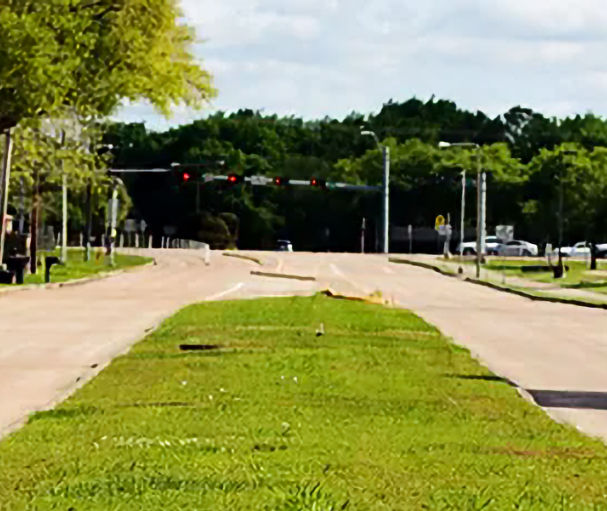
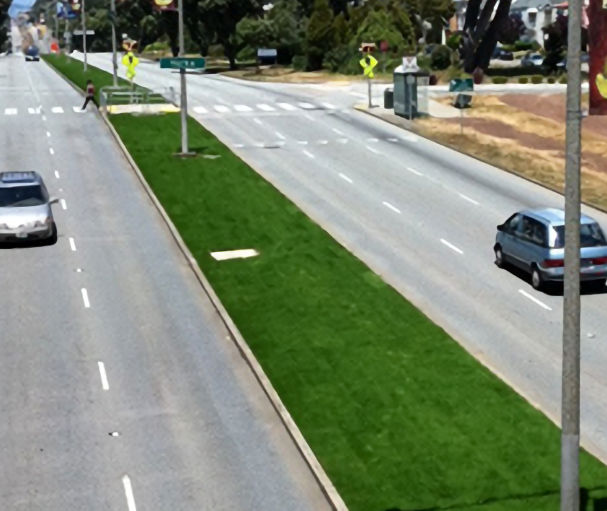
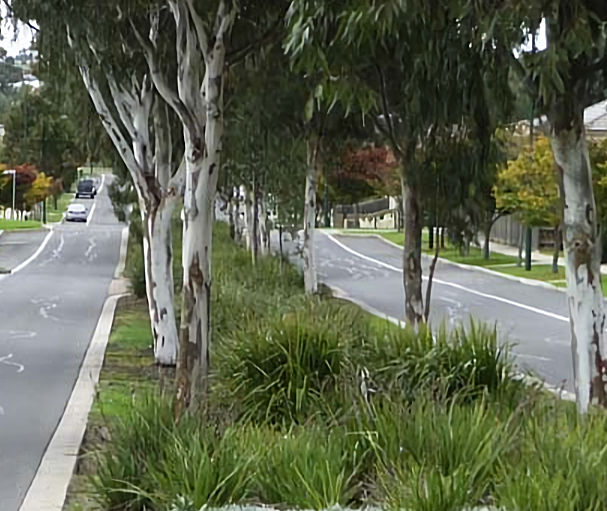
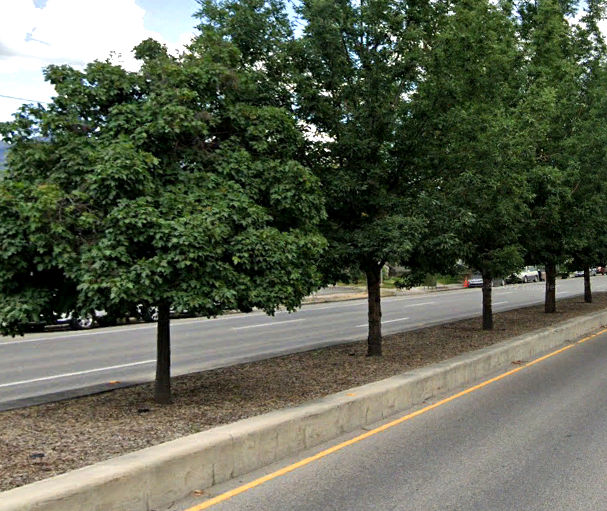
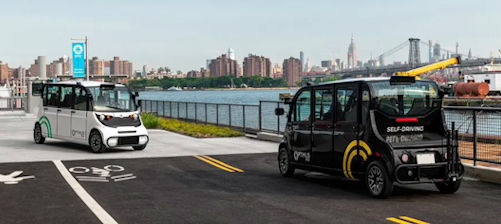
Roads are designed for higher speeds, while streets aim for lower speeds. Images below
depict common median situations and their effect on speed relative to a typical 5-lane Stroad.
Roads
 |
Stroads
|
Streets
|
|

|

|

|

|

|

|
||
| The Red outline is closest to your depiction. | |||
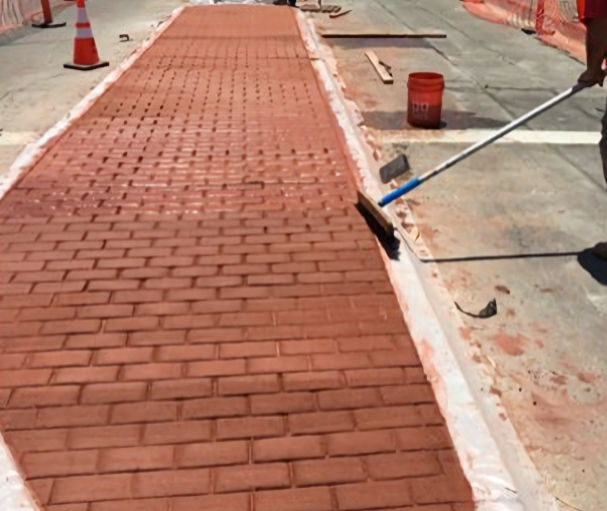
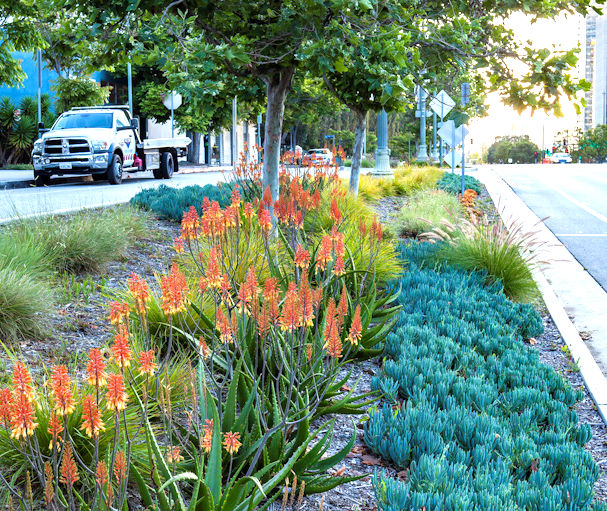
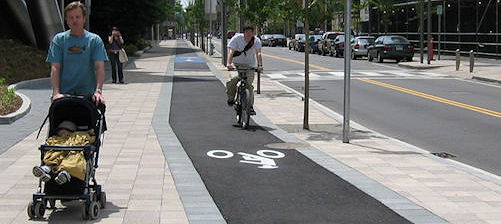
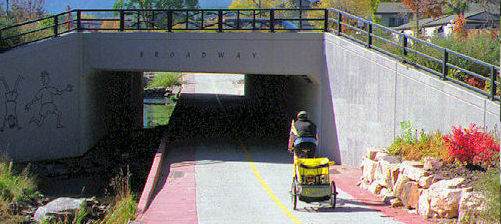
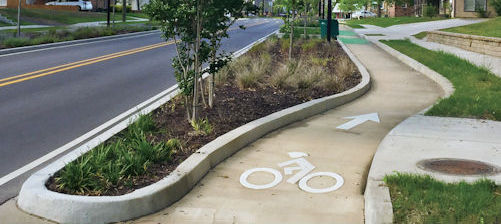
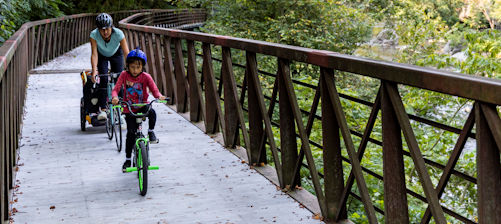
A high density of street trees and buildings creates a sense of enclosure. Large trees that are
close to cars creates “visual density” and drivers slow down as they search for potential
conflicts. Red outline is closest to your depiction.

|
Trees: too few, too small - compacted soil prevents root growth and “weed whackers” damage trunks. Buildings: Very little residential; large parking lots. |
Trees: Many and large, due to Silva Cells or root trenches. Within 10-ft of cars. Buildings: Many within 5-ft of sidewalks. Significant residential. |

|
|

|
Trees: Many, but small due to species or constrained roots. Within 10-ft of cars. Buildings: Many within 5-ft of sidewalks. Significant residential. |
Trees: Many and large, due to Silva Cells or root trenches, but further than 10-ft from cars. Buildings: Many within 5-ft of sidewalks. Significant residential. |

|
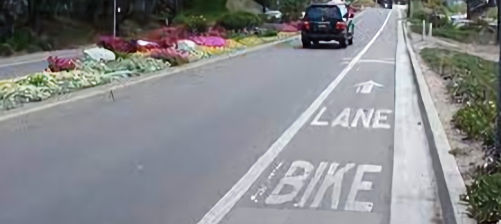
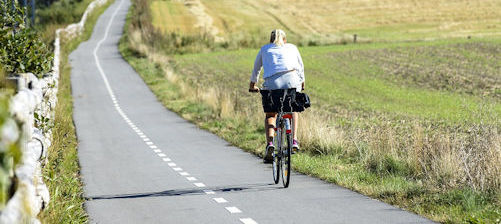
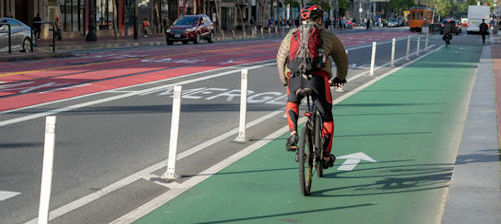
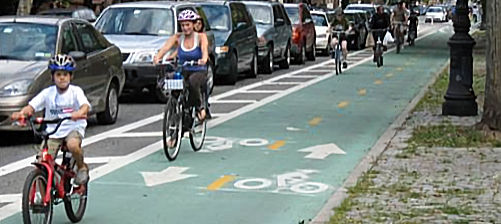
Parking and shoulder uses affect speed because drivers exercise caution when
visibility is challenging and when objects are close to their lane. The scenes below are
not comprehensive. StreetPlan interpolates these factors based on closest match.

|
Stroad Datum: Wide shoulders with few if any parked cars. If you show a parked car, StreetPlan interprets this as “significant demand for parking” (probably greater than 50%). If parking is allowed, but little demand, better to show empty. |
Parking: A significant number of parked cars will slow traffic due to “side friction” (getting in and out of spaces). There is also lower visibility and higher perceived danger, so most will drive slower. |

|
|

|
Bike Lanes, etc: Bike lanes next to traffic do not measurable affect traffic speed unless there are a LOT of cyclists. Basically, it’s still an empty shoulder that provides wide visibility, so driving is still fast. Change this factor if your circumstance is different. |
Bulb-outs and Trees: Pedestrian bulb-outs and trees planted IN the parking lane will slow traffic even more than parking alone, due to higher visual density and a greater sense of enclosure. Want slower speeds? Get people and trees closer to cars! |

|
These treatments are not easily detected in cross-section views. Select all that apply. The factor is what this treatment does to average speeds.

|

|

|
| Factor: (Bump_Lcl) | Factor: (Bump_Col) | Factor: (Bump_Art) |

|

|

|
| Factor: (Pavers) | Factor: (Paint) |
Factor = Limit +
Why? (OneWaySync)
|
Traversing speed is slower than cruise speed, due to delay at intersections. If you implement
“Placemaking Alternative Intersections,” (PAIs) you may be able to reduce cruise speed for safety
and still increase traverse speed! It’s called “Drive Slower, Travel Faster!” The tortoise vs the hare!
PAIs have fewer phases (less delay). Suppose Existing has three 4-ph signals per mile, but the new design can use “Quadrants” to convert them to 2-ph. Use the table to define three 4-phase, then again for the Quadrant cross-section and define three 2-phase. The yellow “Your Speed” might go down by a lot (good for safety!), while blue traverse speed might even go up! (good for getting home!)
|
4-ph | 3-ph | 2-ph | Totals |
|
||||
|
3 | |||
| Seconds stopped | ||||
| Minutes stopped | ||||
| Min moving @ mph | ||||
| Minutes for 1-mile | ||||
| Peak traverse (mph) |
|
|
Speed Limit for this cross-section |
|
|
Common cruise speed with current features (yel tabs) |
|
|
Traverse speed with intersections defined in table. |

Bike and Pedestrian safety is affected by the speed of traffic, number of lanes, availability of median refuge, parking or other buffers that protect pedestrians, overall intersection complexity, and whether the street is one-way or two-way.
StreetPlan automatically detects probable cruise speed, lanes each direction, and makes an "educated guess" at other factors. It then weights speed heavier than other factors, to arrive at an overall score between 1 and 5.
You can change factors or weights below. Set up a before and after cross-section to see how safety changes!
| Safety Score Calculation | Factor | Stars | Weight | Weighted |
|---|---|---|---|---|
| Cruise Speed (Your Spd) | 42 | 1.8 | 0.54 | |
| Lanes per direction | 2 | 3.0 | 0.45 | |
| Median Refuge | None | 1.0 | 0.15 | |
| Parking and Buffers | None | 1.0 | 0.15 | |
| Intersection Complexity | High | 1.0 | 0.15 | |
| One-Way Bonus? | No | 2.0 | 0.20 | |
| Five-Star Rating Score | 1.5 | |||
| Your Speed Up to... | Star Rating |
|---|---|
| 10 mph | 5.0 |
| 15 mph | 4.8 |
| 20 mph | 4.6 |
| 25 mph | 4.3 |
| 30 mph | 3.8 |
| 35 mph | 3.3 |
| 40 mph | 2.5 |
| 45 mph | 1.8 |
| 50 mph | 1.2 |
| 55 mph | 0.7 |
| 60+ mph | 0.0 |
| Median Refuge | Star Rating |
|---|---|
| None | 1 |
| Some | 3 |
| Many | 5 |
| Intersection Complexity | Star Rating |
|---|---|
| High | 1 |
| Medium | 3 |
| Low | 5 |
| Lanes each Direction | Star Rating |
|---|---|
| 1 | 5.0 |
| 2 | 3.0 |
| 3 | 1.0 |
| 4+ | 0.0 |
| Parking & Buffers | Star Rating |
|---|---|
| None | 1 |
| Some | 2 |
| Good | 3 |
| Excellent | 4 |
| |
| User Selected | Yellow Tabs |
| |
| Calcs on This Tab | |
Part 1: Speed Estimation Methodology
See Part 2: Drive Slower, Travel Faster!- Start with posted speed limit (say 30 mph)
- Lookup a "maximum common cruise speed," constrained only by fear of getting a ticket (42 mph in this case)
- Apply reduction factors: We can detect some factors in your cross-section, and you specify those we can't detect.
- Compare against a datum for each factor. Say you have three factors:
- F1 = Lane width factor: Datum is 12-ft lanes (F1 = 1). Your lanes will be 10-ft (F1 = .92)
- F2 = Median factor: Datum is TWTL (F2 = 1). Your median will have many large trees (F2 = .93)
- F3 = Shoulder: Datum is "Wide, no parking" (F3 = 1). You will have parking w/trees & bulb-outs (F3 = .85)
- The combined effect of multiple factors follows a dampening function: as you add more and more factors, the effect of each is less and less.
- To dampen, first order factors from strongest to weakest (.85, .92, .93)
- The strongest keeps full effect, but the others are dampened from .92 to .95, and .93 to .96 respectively
- Fpre-dampen: .85*.92*.93 = .72; Fpost-dampen = .85*.95*.96 = .78
- Recall speed limit is 30 and "fear of ticket" speed is 42 (datum speed).
- Pre-dampen speed is 42*.72 = 31 mph. Post-dampen speed is 42*.77 = 33 mph
- Thus, you could expect your design to see "common speeds" (or 85th percentile speeds) at about 9 mph slower (42-33) than the default, wide-open street (which in this case would be a Stroad also signed at 30 mph). 33 is still faster than the speed limit, but not nearly as much as the comparable Stroad!
Part 2: How to Drive Slower but Travel Faster!
See Part 1: Speed Estimation MethodologyTraffic engineers are often reluctant to support traffic calming strategies, concerned that it will cause trips to take longer. However, it is often possible to reduce "cruise speeds" to safer levels, and also keep drive trips the same if not a little faster. The key is to reduce how long drivers are stuck at traffic signals.
Urban Innovators is the nation's premier specialist in "Placemaking Alternative Intersections." Learn more here, but the key is to increase signal green time by reducing signal phases from 4-phases, to 3 or even 2-phases.
Within StreetPlan, we estimate how long it will take to drive one mile along a street with the cross-section you designed. To do this, we calculate not only the likely "cruise speed," (Part 1), but also the "A-to-B" speed after factoring in the number and type of intersections you specify.