free Complete Street design tool, or learn
more about it below.


 Introducing StreetPlan, a free drag & drop tool for creating Complete Street ideas in just minutes. StreetPlan analyzes your design as
you make it, giving you instant color-coded Best Practice guidance from the Institute of Transportation Engineers and the Congress for New Urbanism.
Want to jump right in? Try it here now for Free!
Want a few more details? See our Key Features doc.
Print a one-page flier for your office here.
How Can StreetPlan Help You?
- Are You an Urban Planner?
- Gain quick consensus on what stakeholders want, so you can focus on how to get it!
- Create low-cost street upgrades, expanding to a full vision in later phases.
- Depict typical section standards for new streets
- Save time/money with do-it-yourself high-res graphics for your plans and meetings
- Hire architects & engineers after stakeholders agree on a vision.
- Get public feedback on your ideas
- Create excitement for Complete Streets and Sustainable Development
- Encourage consultants to use StreetPlan for your plans and corridor studies
- Architect or Consultant?
- Gain competitive advantage with StreetPlan’s “free and fast” high-quality renderings
- Use StreetPlan to help stakeholders unify around a small set of ideas, then create higher-quality, 3D renderings your normal way once you’ve narrowed the choices.
- Concerned Citizen?
- Create sketches of what you’d like to see, then rally your neighbors to city hall!
Start using StreetPlan now! No download required! Note: StreetPlan is brand new. It has bugs that we know about, and more to be discovered. If you find bugs or opportunities for improvement, please let us know!

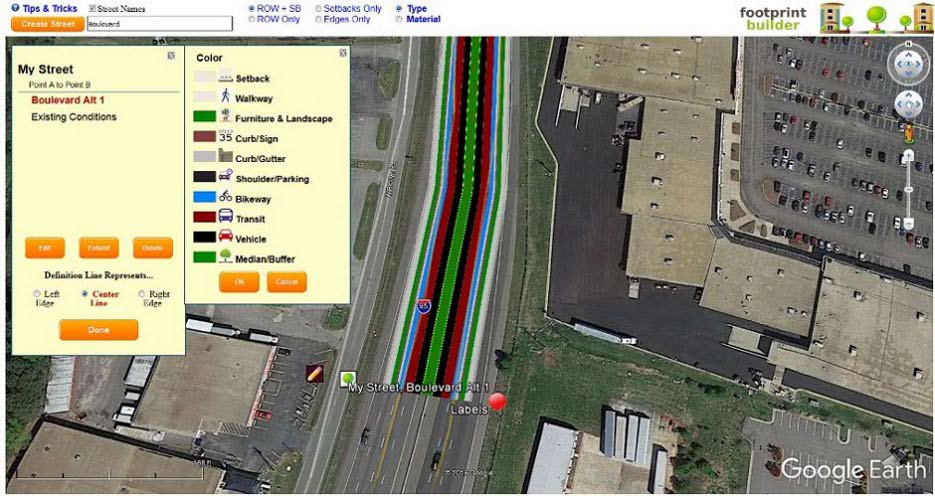
After you create a cross-section, use the top-view button  to start
StreetPlan’s Aerial View module. This map-based tool lets you zoom in and apply the
cross-sections you just created directly at the location you hope to change. Will your
preferred concept require more right-of-way? StreetPlan – Aerial can show you if that is
practical, or impossible.
StreetPlan – Aerial can be linked directly from your city’s website, allowing you to depict your entire transportation master plan, or concepts for corridor studies, so your citizens, prospective developers, and economic development targets can offer feedback and start getting behind a vision that they’re helping to craft.

A common complaint from engineers is that Complete Street strategies can result in safety hazards and excessive traffic congestion. Such strategies include road diets, transit-only lanes, on-street parking, reducing speeds, and narrowing lanes. It is true these things can hinder traffic, so if there are few parallel options for traffic, and a likelihood of even more future traffic, then you may need to mitigate their concerns or it could stop your momentum.
StreetPlan includes sketch-planning diagnostics to help you know if your designs could be problematic for the scale of traffic you’ll likely need to accommodate. In addition, Metro Analytics advocates recent advances in traffic efficiency made possible by what they refer to as “Place-Making, Innovative Intersections.”
Signalized intersections are the single biggest factor affecting traffic flow, and if you can remove or relocate left-turn arrows, flow can often be greatly improved. Further, such turn arrows complicate signals and inadvertently create intimidating, excessively slow pedestrian environments. If you do everything right for form, but your intersections remain dominated by “old-school traffic engineer-thinking” as they deem necessary for function, then you may still fail to attract quality economic development and won’t get your full money’s worth from your Complete Street investments.
Sadly few planners and fewer engineers are even aware of these Place-Making, win-win designs. Of those who are aware, few understand how to analyze them for your situation, or how to help your community get behind these creative, effective ideas. In future versions of StreetPlan, Metro Analytics will embed these benefits directly into the tool. For now, refer to Metro’s Introduction to Place-Making, Innovative Intersections, or contact Metro directly for advice.

You’re designing a street for transit, but will there really be enough ridership to warrant the expense of transit? Maybe you’re redesigning an existing street to catalyze walkable, transit-oriented development, but even walkable development still generates vehicle trips. Will traffic increase or decrease relative to today? Will the lanes you’re planning be right- sized for your build-out situation? StreetPlan has some sketch planning features to help discern ultimate vehicular and transit demand, and more will be added as time and funding allows. But right-sizing for demand is difficult to generalize, as each situation is unique.
Metro Analytics specializes in demand analysis, and we are experts in Cube-Voyager and TransCad models. However regional travel demand models are expensive to run and are not usually attuned for the finer details of walkable Activity Centers and Boulevards (see 7- D land use strategies). As a more practical option, Metro’s consultants can quickly review your existing demand and discern your 6-D opportunities to manage traffic on the streets in question. We can also advise you of 7-D land use strategies, 8-F transit strategies, and give you our quick-review professional opinion on the adequacy and appropriateness of your plans for traffic, transit, walk, bike, and economic development. We can also give you additional insights and enhanced strategies to help ensure you’ll achieve your desired outcome. Contact Metro Analytics if you’d like to explore how they can help, and potentially arrange a free webinar for your stakeholders.

“Sustainable” – a word that implies environmental responsibility, but also implies operational longevity at a good-value price. So when was the last time you heard “sustainable” and “freeway” in the same sentence? Freeways facilitate sprawl and associated environmental consequence. With each widening their cost per lane mile is exponential, yet they often fail just a few years later in part due to induced demand.
It’s a real catch-22. On one hand, their environmental, monetary, and social costs are catching up to us. On the other hand, huge shares of us depend on freeways heavily, and we all use them in unseen ways. Is there any way to reinvent them so they can always operate at high speeds, yet at the same time stop accelerating sprawl, stop inducing demand, and stop the pressure to “build our way out of congestion?”
Metro Analytics is building upon recent technological advances to do just that. Study our ideas at FreewayOptimization.org. It may take a bit to grasp the concept, but it could result in politically-possible win-win effects…
- 50 mph or faster at 5-pm, without ever needing to increase the number of lanes.
- 30% or more increase in 5-pm freeway throughput, milked from the same lanes
- Fewer vehicles on congested, parallel arterials
- Higher transit ridership
- Billions worth of increased economic productivity
- Innovations that render “HOT lanes” obsolete.
- Incentives to motivate living closer to work.
- Low implementation and maintenance cost
- Less sprawl, despite having high speed drive options available 24-7.
- Reduced VMT and reduced carbon emissions, relative to more typical solutions.
To be fair, freeways may never be “perfectly sustainable.” But they are a permanent feature, and these ideas should help them be much more sustainable for the environment and for our wallets. Learn more at FreewayOptimization.org.

There are six fundamental strategies for dealing with traffic congestion. The most common is the “Direct” approach, or “Build your way out” approach, which usually equates to increasing capacity directly on the facility in question.
However there are other “D-strategies” which Metro Analytics always evaluates before conceding a need to directly increase capacity. And even when we agree that direct new capacity is a good idea, we have unique place-making methods for increasing vehicle capacity in ways that also improve walkability and economic vitality.
Here are the 6-D strategies for managing traffic congestion:
- Divert – If one corridor is overwhelmed, look for opportunities to improve competing paths and “Divert” some trips away from the struggling corridor through connectivity and alternative paths.
- Deduct – People drive because their alternatives are impractical or unattractive. Create strategies to help people “Deduct” themselves from vehicular traffic in sensitive areas such as downtowns by improving the experience of alternative modes. Then such modes can compete effectively for many trips.
- Delete – You can “Delete” vehicle miles traveled (VMT) in part by optimizing land uses. How far do people have to go “to get a gallon of milk?” Are the locations of future schools and parks well centered to encourage walking? Review the land use elements of your plans to discern its likely effects on transportation, and also to discern the likely effects of your infrastructure plans on efficient land use.
- Dynamic – Technology is making it much easier to “Dynamically” guide people to under-utilized streets, and to enhance multi-modal options. Automated vehicles and other advances promise to increase the efficiency of streets, as well as ability to move more people in fewer vehicles. Technology is helping us accomplish more activities in shorter distances – often without even traveling at all. Consider the role of changing technology in your future plans.
- Direct – After pursuing previous strategies, increase capacity “Directly” on the corridor in question if necessary. First pursue efficiency gains through use of place-making innovative intersection designs, such as Quadrants, Bowties, Town Center Intersections, and Roundabouts. Then consider options like Continuous Flow Intersections. Finally, sometimes widening select locations and building entirely new facilities is the right thing to do in locales where the population is increasing substantially.
- Deal with it – To some it may seem defeatist, but there is psychological benefit to just “accepting the things you cannot change.” Have you already done what you could afford to do? Is your community in a long struggle for political will to do more? Are there some strategies your community simply never wants to do? Then just “deal with it” and decide to be happy in spite of, and maybe because of, the “negatives” of congestion. “No Build” doesn’t need to be a straw-man option.
If you’re in a quagmire and no one is bringing fresh ideas to the table, contact us! As Einstein said, “Today’s problems cannot be solved by the same level of thinking that created them.” The staff at Metro Analytics are trained to think differently, and find solutions others overlook or simply lack the expertise to even see.

Dr. Reid Ewing, of the University of Utah’s Metropolitan Research Center, is among the nation’s leading researchers on the ability of the “7-D’s” to reduce Vehicle Miles Traveled (VMT). Dr. Ewing is an occasional consultant for Metro Analytics, and can advise communities on actions they can take to reduce VMT by means of the 7-D’s.
Here are the key attributes of 7-D Boulevards and Activity Centers:
- Density – as an activity center’s density increases, VMT per capita decreases. The more things are close together, the more likely you can walk, bike, or ride transit. And for those who still drive, it will be a shorter drive.
- Diversity – If most houses are in suburbs, and jobs and necessary items are far from home, the result is huge amounts of driving. Consider form-based codes and other strategies to reduce restrictions on specific kinds of uses, and focus more on how well it all fits together. Then more people can be closer to the places they need to go.
- Design – If the local street system has more connections (less circuitous paths and fewer cul-de-sacs), it will be easier for more people to reach transit, or to walk, bike, and take short drives. Complete Street design features also increase walking, biking, and catalyze development consistent with the other D’s.
- Destinations – Part of what helps define a “Place” or an Activity Center is that it has popular destinations that attract people from all over the region, such as theaters, sports arenas, etc. Transit is more likely to focus on serving centers with popular destinations, and hence more able to reduce VMT.
- Distance from Transit – It does little good to install nice transit stations, and then put a used car lot or a gas station as the first use next to that station. People use transit if transit is close, so communities are wise to adopt minimum zoning standards within a quarter mile of a rail or BRT station (such as “at least 40 units per acre if residential, or at least four-story office buildings with ground-floor retail, if commercial”). It is also good to relax or eliminate parking requirements. Developers know they must provide adequate parking, so why risk making them build too much?
- Demographics – Many people want to live in higher density, walkable, mixed-use areas where they can take transit and won’t have to drive as much. Growing numbers of seniors need to, and many who are not yet raising families want to. But if the only quality places available are single family homes designed for raising kids, they’ll end up in those even if they’d prefer something else. If we design Activity Centers with our changing demographics in mind, our parents and children can stay close by. They need not contribute to congestion, and the elderly can avoid “white-knuckle” driving conditions.
- Demand Management – When vehicle demand is too high, we have three options: 1) Increase supply to match demand (usually widening roadways – which may not last long); 2) Reduce demand to match supply (make it easier and desirable for some people to choose something else); or 3) Just ignore it, which will eventually make it better – as people move their businesses out of your indecisive town! Focus on Option 2: there are many demand-management policies such as helping transit get out of congestion or installing paid-parking in specific locations. Consider Metro’s new idea for Managed Motorways + Congestion Credits. All of these reduce demand.

Why do we prefer trains over buses? There may be some magnetic, nostalgic pull in steel wheels, but there are also more practical reasons. If we can mimic those with buses, then buses can attract more riders, often at lower costs per rider.
Say you see a random bus. Is it an option for you? Not if you don’t know where it came from, where it is going, or how often it comes by. A train track passively informs us where we can get on and off. So how can buses be more like trains? Here are Metro Analytics’ “8-Fs” for creating “bus tracks” nearly as visible and potentially much more popular and influential on economic development, per dollar spent, than trains.
- Frequent – Vehicles come so often that no one needs to bother with a schedule.
- Familiar – No need to research routes. “You Are Here” signs & route branding strategies help “bus tracks” become common knowledge.
- Fare – Free fare zones, routes, times, and other fare incentives can attract short circulation trips that simply will not pay a fare if they have another option.
- Fast – If possible, reduce time spent at stops or in congestion, to attract more riders (queue jumpers, limited stop, dedicated lanes, off-board payment, etc).
- Focus – Avoid circuitous routes and low-value diversions. Simple, direct routes to major destinations are faster and easier to commit to memory.
- Fun – Who designed the Corvette? We need them to tackle the big, ugly bus. Do they all really need to be so huge? Smaller vehicles, more often = same seat miles. Cool vehicles & stops, creative marketing – do little things that remove stigmas.
- Flexible – Even permanent bus infrastructure is easier to change than rail, if necessary. Buses can skip some stops and pass slower buses (trains can’t), and buses can deviate from fixed-guideway when necessary.
- Frugal – Lower cost per mile = more miles of service! (i.e. Frequency). Trains usually have high construction cost relative to BRT, and don’t always “make up the difference” through reduced operating cost. Big empty buses every 10-minutes also doesn’t seem frugal, so smaller, fuller mini-buses might be ideal.
We elaborate on these concepts in this white paper entitled “The Eights” of Making Buses More Like Trains! Additional topics in the paper include:
- 8 Rules for Creating Multi-Route Branded Corridor Segments (a strategy for creating an “almost no-cost track” where 2 or more routes happen to overlap).
- 8 Transit Enhancements to Attract Riders
- 8 Strategies to Minimize Operational Costs and Acquire Operating Funds
- 8 Rubber-Tire Vehicle Styles That Could Work Well for Circulation
- 8 Examples of Branded Bus Corridors in the US and Australia
To be clear, trains may well be the right solution for many situations – we are not “anti- train.” But buses are not going away, and these are ideas that could help you get greater return on your investment in buses.

You have invested millions in models, Big Data collections, etc. But how well can you “see” the data you have right in front of you? What story does it want to tell? Are you mining your data in effective ways to convince the public and stakeholders to support your plans and strategies? With mountains of data, there is a real need for data miners who can strike gold and extract pearls of wisdom with insightful performance measures that reveal benefits, costs, and consequences of different scenarios. Here are a few tools and techniques that we use.
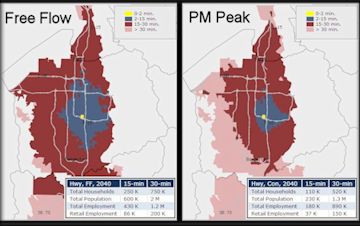
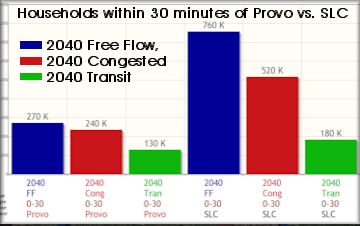
| Dynamic Accessibility Maps | Dynamic Accessibility Charts | Artistic Renderings |
 |
 |
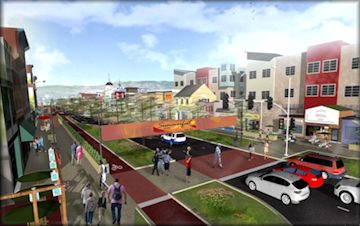 |
| Click on any zone and the tool updates access contours and demographic tables. | Select jobs or households - a dozen options, to auto refresh. Chart any data! | Pictures that tell your story and move people to action. |
| Visual Walkability with ViaCity | Google Earth 3D Analysis | Connectivity & Network Spacing |
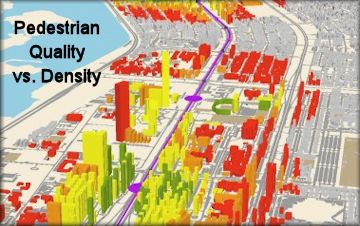 |
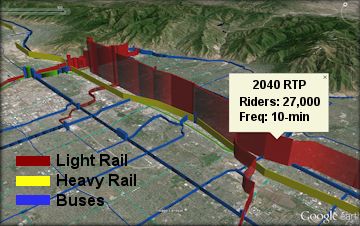 |
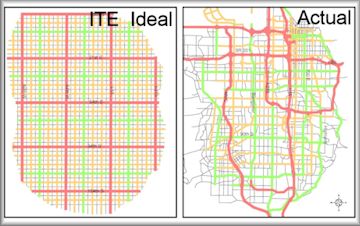 |
| Where will active transportation projects make the most difference? | We convert your Performance Measures to 3D for self-guided internet tours. | Poor grid spacing causes problems. Got problems? We know what to do. |

Are you passionate about your work? Have you burned the candle at both ends for years? If so, then you’re probably popular within your niche. Getting a new job isn’t the problem. You want a GREAT job! But if you switch jobs, again… won’t you just be trading the devil you know for the devil you don’t? If you’re an A-player and tired of devils, read on. It could change your life!
Here are some “devils” our program helps solve. Many firms, in their quest for profit and productivity, can lose track of what it takes to make money in the first place. Say you’ve got a great idea, but also have lazy or unhelpful managers who don’t see what you see and are too stuck in cost-cutting mode. Hence you have no champion to help you acquire the funds and talent you need for your vision. They won’t even lower your own billability target to give you time to work your plan.
More devils… You know you could do your job from home most days, but they insist you’re there
between 9 and 4 most days, forcing you to blow huge amounts of time and money commuting. Then when it’s time for your performance review, you’ll
get a minuscule raise and an unimpressive bonus. Do they even know what you do for them? Do they realize you’re responsible for revenue far beyond
what they’re paying you?
When they sense you’re unhappy, those same executives will drone on about the huge amount of unavoidable overhead, much of which clearly benefits you. Yes, they do pay for your trips to local and national conferences – after you turn blue convincing them they’ll benefit from your attendance. They pay for your computer, software, insurance, and retirement. They also have impressive behind the scenes infrastructure such as accounting, legal, IT, and marketing support to help ensure your day goes well and you get paid every two-weeks. You need these things!
But they also have overly-luxurious offices at premium addresses. They have excessive support staff and middle-managers that you seem to support more than the other way around. They spend lavishly on parties, travel, dining, and premium hotels. Even low-level staff spends much more than they need to, as they have no personal incentive not to. This is not how you’d run the business if it were your own!
You think of colleagues who’ve started their own firms and seem to be doing ok. Maybe you know a few freelancers who are happy and doing ok. Each time you’re tempted to try something like that, fear carries the day. “I don’t know how to start a company, and I don’t even want to! I like my specialty and don’t want to start learning tax laws, accounting, etc.” Freelancing could offer a lot, but you’d still have to learn more than you have time and resources to discover through the school of hard knocks. Plus being all alone is risky, and your best clients may go elsewhere if you don’t have a good team.
The best firms in your field have strong reputations with your clients and always win exciting projects. They have talented people that you enjoy working with and learn a lot from. While their paychecks may be unimpressive relative to the value you add, at least their checks are just 2-weeks away, and that matters a lot if you can’t afford “freelance” mistakes.
So you can stick with the devils you know, or get another job and deal with similar devils plus some new ones. Or you can call Metro Analytics to learn about a new exciting option that combines the stabilizing, best features of traditional firms with the independence of freelancing. If you’re a good fit for our program, you could boost your after-expenses take- home pay 50% or more! Plus you can run your life on your schedule, own all your intellectual property, and still continue to win exciting projects and work with excellent teams!
To learn more, see our Career Opportunities page.
StreetPlan
StreetPlan – Complete Streets
StreetPlan – Aerial View
StreetPlan – Form & Function
StreetPlan – Travel Demand
Sustainable Freeways?
6-D’s of Traffic Management
7-D’s of VMT Reduction
8-F’s of Transit Ridership
Urban Visualization Tools
Are you tired of your job?
Not paid what you’re worth?
